

Image Details
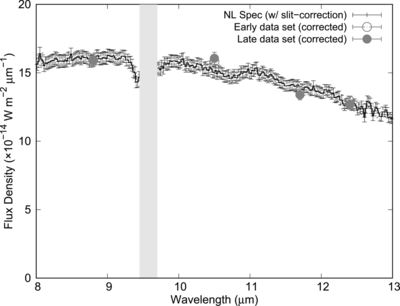
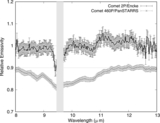
Caption: Figure 6.
N-band low-resolution spectrum of 2P/Encke on UT 2003 November 12.29, together with the photometric data shown in Figure 5. The gray-hatched area is the wavelength region influenced by the telluric ozone absorption.
Other Images in This Article
Copyright and Terms & Conditions
© 2026. The Author(s). Published by the American Astronomical Society.

Copyright ©
2026 Astronomy Image Explorer. All Rights Reserved.
