

Image Details
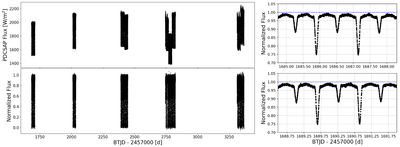
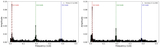
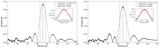
Caption: Figure 3.
Top: TESS light curve (PDCSAP flux) of KIC 9451096 over time, using data from sectors 14, 26, 40, 41, 53, 54, 55, 74, and 75. The PDCSAP photometry is represented by black dots, showing the brightness variations obtained from TESS observations. Bottom: the PDCSAP light curve derived from the representative Sector 14 data, after median detrending and compared with a reference light curve near maximum brightness, clearly reveals the O’Connell effect through the asymmetry between the primary and secondary maxima.
Other Images in This Article
Show More
Copyright and Terms & Conditions
© 2026. The Author(s). Published by the American Astronomical Society.

Copyright ©
2026 Astronomy Image Explorer. All Rights Reserved.
