

Image Details
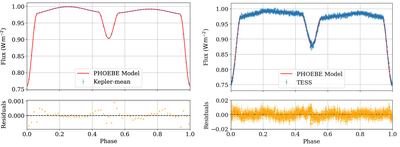
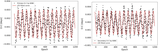
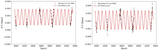
Caption: Figure 14.
MCMC model fits to the Kepler and TESS light curves with corresponding residuals. The left panel shows the fit to the Kepler data, while the right panel presents the fit to the TESS data. The low-amplitude residuals show no systematic trends over the orbital phase, demonstrating the robustness and precision of the MCMC optimization, while localized residual structures near the light-curve maxima reflect the asymmetric brightness distribution characteristic of the O’Connell effect.
Other Images in This Article
Show More
Copyright and Terms & Conditions
© 2026. The Author(s). Published by the American Astronomical Society.

Copyright ©
2026 Astronomy Image Explorer. All Rights Reserved.
