

Image Details
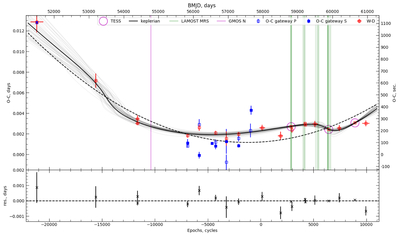
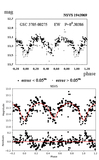
Caption: Figure 5.
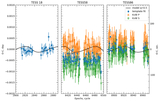
O − C curve fit using parabola (dashed line) plus Keplerian orbit (solid line). Gray lines shows 100 randomly chosen models from EMCEE sample. Horizontal axes are shown with units in cycles (bottom) and BMJD (top) for convenience. Vertical lines indicate times of spectral observations. Residuals are shown in the bottom panel. TESS data points are highlighted by open circles. Data points corresponding to O − C gateway provided minima times are shown, but not used during fit.
Other Images in This Article
Copyright and Terms & Conditions
© 2026. The Author(s). Published by the American Astronomical Society.

Copyright ©
2026 Astronomy Image Explorer. All Rights Reserved.
