

Image Details
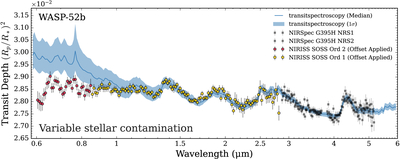
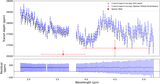
Caption: Figure 6.
The NIRISS/SOSS (M. Fournier-Tondreau et al. 2025) and NIRSpec/G395H combined spectra overplotted with the atmosphere+spots spectral model fitted with the NIRSpec/G395H TRANSITSPECTROSCOPY data. The varying slope toward the short wavelength (≤1.5μm) is potentially indicative of the time variability of stellar active regions (starspots and faculae) on the host star.
Other Images in This Article
Copyright and Terms & Conditions
© 2026. The Author(s). Published by the American Astronomical Society.

Copyright ©
2026 Astronomy Image Explorer. All Rights Reserved.
