

Image Details
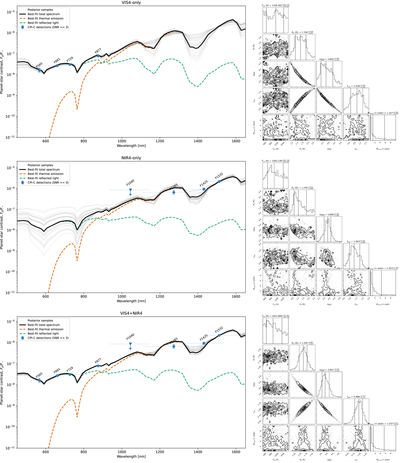
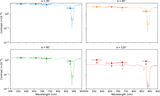
Caption: Figure 16.
A comparison of the VIS4-only, NIR4-only, and VIS4+NIR4 retrievals for the synthetic giant planet. Each row shows one dataset. The left panels show the best-fit planet–star contrast spectra and posterior spectral samples. The black curves show the total model spectrum, the orange-dashed curves show the thermal-emission component, and the green-dashed curves show the reflected-light component. Blue points mark CPI-C detections with S/N ≥ 3, and the F1040 measurement is shown as a 3σ upper limit when it is not significantly detected. The right panels show the corresponding posterior distributions for Tint, Rp, ﹩\mathrm{log}g﹩, fsed, and Mcloud.
Other Images in This Article
Show More
Copyright and Terms & Conditions
© 2026. The Author(s). Published by the American Astronomical Society.

