

Image Details
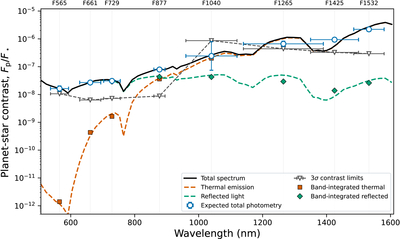
Caption: Figure 15.
Spectral decomposition and simulated CPI-C photometry for the synthetic giant planet. The black solid curve shows the total planet–star contrast spectrum, and the orange- and green-dashed curves show the thermal-emission and reflected-light components, respectively. Open blue circles show the expected band-integrated total contrasts. Their vertical error bars represent the propagated photometric uncertainties, and the horizontal bars show the nominal filter widths centered on the adopted band wavelengths. Orange squares and green diamonds show the band-integrated thermal and reflected components. Gray inverted triangles connected by a dashed line mark the per-band 3σ sensitivity thresholds. The NIR4 thresholds are first determined as apparent AB-magnitude limits from the adopted noise model and are then expressed in contrast units using the band-integrated PICASO stellar spectrum.
Other Images in This Article
Show More
Copyright and Terms & Conditions
© 2026. The Author(s). Published by the American Astronomical Society.

