

Image Details
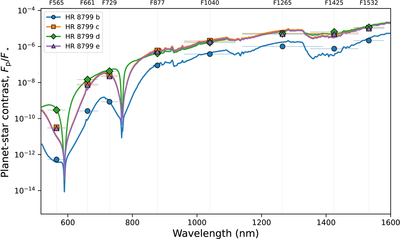
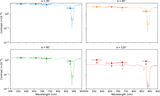
Caption: Figure 14.
Thermal-emission planet–star contrasts predicted for HR 8799 b, c, d, and e from the adopted Exo-REM models. The solid curves show the monochromatic model contrast spectra, and the symbols show the band-integrated contrasts listed in Table 6. The dotted vertical lines and upper labels mark the effective wavelengths of the eight CPI-C filters. Reflected light is not included.
Other Images in This Article
Show More
Copyright and Terms & Conditions
© 2026. The Author(s). Published by the American Astronomical Society.

Copyright ©
2026 Astronomy Image Explorer. All Rights Reserved.
