

Image Details
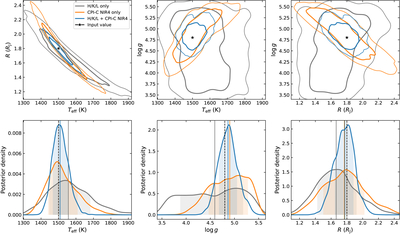
Caption: Figure 13.
A posterior comparison for the synthetic warm giant. The upper panels show Gaussian kernel-density estimates of the joint posterior distributions in the Teff–Rp, Teff–﹩\mathrm{log}g﹩, and Rp–﹩\mathrm{log}g﹩ planes. The contours enclose 68% and 95% of the posterior probability. The lower panels show the corresponding one-dimensional marginal distributions of Teff, ﹩\mathrm{log}g﹩, and Rp. Gray, orange, and blue denote the H/K/L-only, CPI-C NIR4-only, and combined fits, respectively. Colored vertical lines mark the posterior medians, and the shaded regions indicate the central 68% credible intervals. The black stars and vertical dashed lines mark the input-model parameters.
Other Images in This Article
Show More
Copyright and Terms & Conditions
© 2026. The Author(s). Published by the American Astronomical Society.

