

Image Details
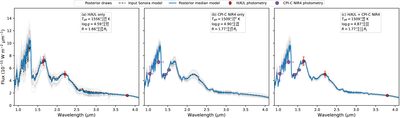
Caption: Figure 12.
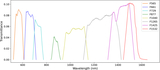
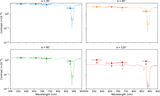
Model fits to the synthetic warm giant for three photometric data combinations. The panels show fits to (a) H/K/L direct photometry only, (b) CPI-C NIR4 photometry only, and (c) the combined H/K/L + CPI-C NIR4 dataset. The dashed black curve is the input-model spectrum used to generate the synthetic data. Gray curves show posterior draws, and the blue curve shows the posterior median model. The H/K/L points are direct samples of the model flux at the adopted central wavelengths and are assigned S/N = 10 in each band. The CPI-C points are generated by integrating the model spectrum through the actual CPI-C NIR throughput curves and applying the adopted noise model.
Other Images in This Article
Show More
Copyright and Terms & Conditions
© 2026. The Author(s). Published by the American Astronomical Society.

