

Image Details
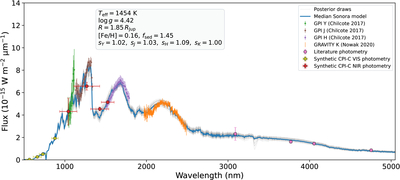
Caption: Figure 11.
A benchmark Sonora Diamondback fit to β Pic b. The fit combines the GPI Y/J/H spectroscopy, GRAVITY K-band spectroscopy, broadband literature photometry, and synthetic CPI-C VIS4+NIR4 photometry. The blue curve is evaluated at the marginal posterior medians, and the gray curves show posterior draws. The yellow and red points mark the synthetic CPI-C VIS4 and NIR4 measurements.
Other Images in This Article
Show More
Copyright and Terms & Conditions
© 2026. The Author(s). Published by the American Astronomical Society.

Copyright ©
2026 Astronomy Image Explorer. All Rights Reserved.
