

Image Details
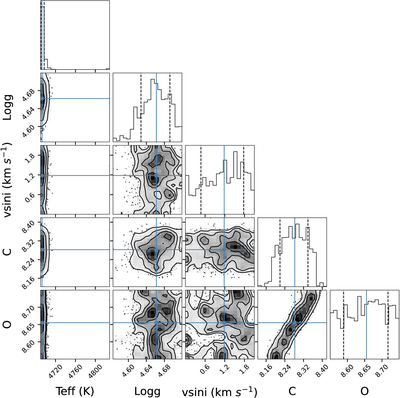
Caption: Figure A2.
Posteriors for MARCS–C/O grid fit to spectral order with C I lines between 7110 and 7119 Å. The oxygen abundance is fixed to ϵO = 8.65 ± 0.10. The marginalized posteriors are shown along the diagonal. The blue lines represent the 50 percentile, and the dotted lines represent the 16 and 84 percentiles. The subsequent covariances between all the parameters are in the corresponding 2D histograms. We obtain a best-fit ﹩\mathrm{log}{\epsilon }_{C}﹩ = 8.28 ± 0.06.
Other Images in This Article
Copyright and Terms & Conditions
© 2026. The Author(s). Published by the American Astronomical Society.

Copyright ©
2026 Astronomy Image Explorer. All Rights Reserved.
