

Image Details
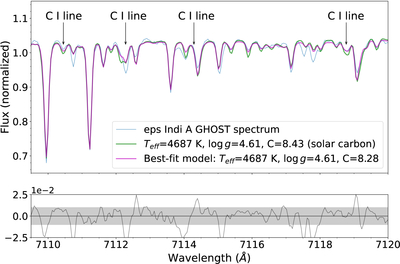
Caption: Figure A1.
Best-fit MARCS-C/O model (magenta) to the GHOST spectrum of ϵ Indi A (cyan), shown for C I lines between 7110 and 7119 Å. The best-fit model has carbon abundance ϵC = 8.28. The residuals between the data and the model are plotted in black and other noise limits are shown in gray. Also shown is a model with the same Teff and ﹩\mathrm{log}g﹩ but with solar carbon abundance ϵC = 8.43 (green). The solar abundance model is a worse fit to the C I lines (especially the 7119 Å line) compared to our best-fit model.
Other Images in This Article
Copyright and Terms & Conditions
© 2026. The Author(s). Published by the American Astronomical Society.

Copyright ©
2026 Astronomy Image Explorer. All Rights Reserved.
