

Image Details
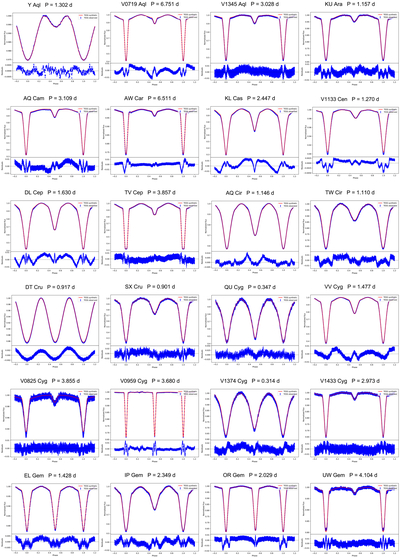
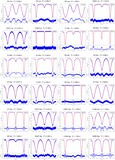
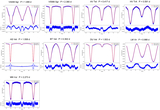
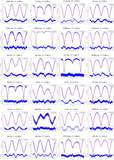
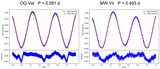
Caption: Figure C1.
TESS light curves and the corresponding best-fitting synthetic models for the nonspotted systems analyzed in this study. The residuals between the observed and synthetic light curves are shown as a function of orbital phase.
Other Images in This Article
Copyright and Terms & Conditions
© 2026. The Author(s). Published by the American Astronomical Society.

Copyright ©
2026 Astronomy Image Explorer. All Rights Reserved.
