

Image Details
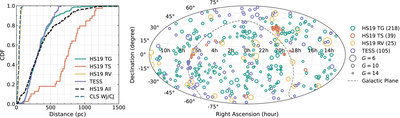
Caption: Figure 1.
Left: cumulative distribution functions of host star distances for different hot-Jupiter (HJ) and warm-/cold-Jupiter (WJ/CJ) samples. The green, red, and yellow lines represent the distance distributions of HJ hosts discovered by ground-based transit (TG), space-based transit (TS), and radial velocity (RV), respectively, from the updated HS19 sample. The purple solid line corresponds to the TESS HJ sample. The black dashed line shows the distance distribution for all HJ hosts in the updated HS19 sample, and the blue dashed line shows that for the WJ/CJ sample from the California Legacy Survey (CLS). Right: spatial distribution of hot-Jupiter host stars on the celestial sphere. The point size scales with the apparent Gaia G magnitude of the host stars. Green, red, and yellow circles indicate HJ hosts discovered by TG, TS, and RV, respectively, from the updated HS19 sample. Purple circles represent HJ hosts discovered by TESS. The gray dashed line marks the Galactic plane.
Other Images in This Article
Copyright and Terms & Conditions
© 2026. The Author(s). Published by the American Astronomical Society.

