

Image Details
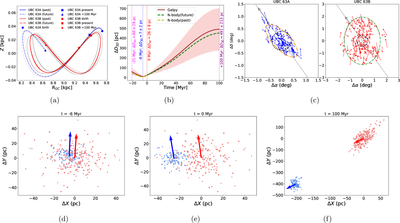
Caption: Figure 2.
(a) The Galactic orbits of UBC 63A (blue) and UBC 63B (red) in the Z–RGC plane. Solid and dashed–dotted curves trace the past and future evolution, respectively. Circles, squares, and triangles mark the birth, present, and future positions (at +100 Myr), respectively. The dashed gray curves denote the 16th and 84th percentile uncertainty bounds from the MC sampling. (b) Temporal evolution of the intercluster separation from –21 to +100 Myr. The solid red curve shows the mean evolution derived from galpy. The corresponding shaded regions indicate the 16th and 84th percentile uncertainty bounds from MC sampling. The yellow and green dashed curves correspond to the past and future evolution scenarios from the N-body simulation, respectively. The birth epoch of UBC 63A, closest approach, the present epoch and the +100 Myr epoch is marked using magenta, blue, red, and purple dashed vertical lines, respectively, with the corresponding separations annotated. (c) The the spatial distributions of UBC 63A (blue) and UBC 63B (red) in a tangentially projected Cartesian plane. The arrows attached to the scatter points denote their first-order corrected proper-motion vector. The gray dashed line traces the cluster orbit and indicates the direction of motion. The black dashed circle marks the Jacobi limit of each cluster. The best-fitting ellipses are overlaid on UBC 63A and UBC 63B, in orange and green, respectively. X–Y projection of the mock cluster of UBC 63A (blue) and UBC 63B (red) at three different epochs: (d) −6 Myr, (e) 0 Myr and (f) +100 Myr as obtained from the N-body simulation. The blue and red arrows represent the space velocity projection of each cluster.
Other Images in This Article
Copyright and Terms & Conditions
© 2026. The Author(s). Published by the American Astronomical Society.

