

Image Details
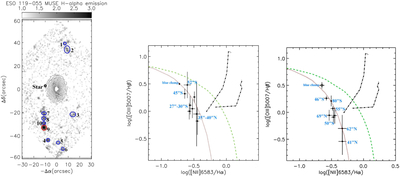
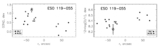
Caption: Figure 5.
The left plot shows a map of the Hα emission in ESO 119-055 (the MUSE data), with the brightest H II-regions encircled and numbered; in the central and right plots—the BPT-diagrams for the emission-line regions in ESO 119-055, both from the MUSE data (center) and from the SALT long-slit cross-sections (right). In the BPT-diagrams, we have marked the points corresponding to individual H II-regions, and some tight groups of the points, by their distances from the center of ESO 119-055. The right plot presenting the long-slit data contains four points from the ESO 119-055 RSS cross-section and four points from the ESO 119-054 RSS cross-section; for the latters their positions along the slit have been recalculated into their distances from the center of ESO 119-055. The diamonds in both BPT-diagrams mark the brightest (number 9 in the MUSE map) H II-region which we think to be a remnant of the merged dwarf. The dividing curved lines are: the green dashed one marks the theoretical border of star formation excitation, from L. J. Kewley et al. (2001), the red dotted one is empirical boundary between star-forming galactic nuclei in SDSS and other types of nuclear emission excitation from G. Kauffmann et al. (2003). The shock-excitation models from M. G. Allen et al. (2008) are also plotted as dash-point lines.
Other Images in This Article
Copyright and Terms & Conditions
© 2026. The Author(s). Published by the American Astronomical Society.

