

Image Details
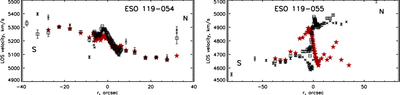
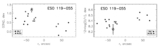
Caption: Figure 4.
The line-of-sight velocity profiles along the slit for the ESO 119-054 (the left plot) and ESO 119-055 (the right plot), according to the SALT data. The reddish stars show line-of-sight velocity measurements for the stellar component, the black signs relate to the emission-line measurements, the Hα (crosses) and [N II]λ6583 (squares).
Other Images in This Article
Copyright and Terms & Conditions
© 2026. The Author(s). Published by the American Astronomical Society.

Copyright ©
2026 Astronomy Image Explorer. All Rights Reserved.
