

Image Details
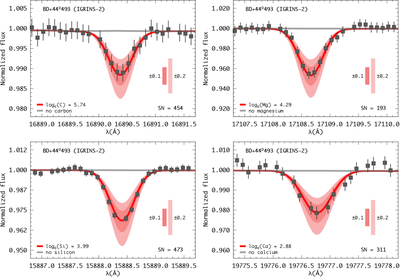
Caption: Figure 3.
Spectral synthesis for carbon (top left), magnesium (top right), silicon (bottom left), and calcium (bottom right). Filled squares connected by the black lines represent the IGRINS-2 spectrum, the red lines are the best fit, and the shaded regions represent ±0.1 and ±0.2 dex from the best-fit abundance. Shown as gray lines are the synthetic spectra without each element.
Other Images in This Article
Copyright and Terms & Conditions
© 2026. The Author(s). Published by the American Astronomical Society.

Copyright ©
2026 Astronomy Image Explorer. All Rights Reserved.
