

Image Details
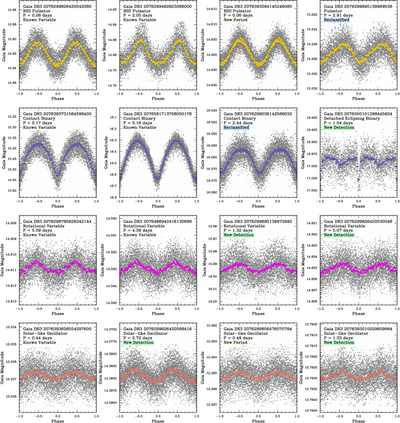
Caption: Figure 4.
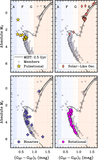
Phase-folded light curves for a sample of variable stars in our catalog, organized by variability class: pulsators (top row), binary-induced variability (second row), rotational variables (third row), and solar-like oscillators (bottom row). Each panel illustrates the best-fit phase-folded period from the Kepler quarter with the strongest periodogram power. Binned data are color-coded by variability class: pulsational variables (yellow), EBs (blue), rotational variables (magenta), and solar-like oscillators (salmon). As this figure makes clear, light-curve morphology alone is frequently insufficient to assign a variability class. For this reason we do not classify on morphology alone but combine it with CMD placement, the power-spectrum structure, and RV orbital solutions and scatter. Labels indicate the status of each source: previously known variables with confirmed classifications, reclassified variables (highlighted in blue), and new detections (highlighted in green).
Other Images in This Article
Copyright and Terms & Conditions
© 2026. The Author(s). Published by the American Astronomical Society.

