

Image Details
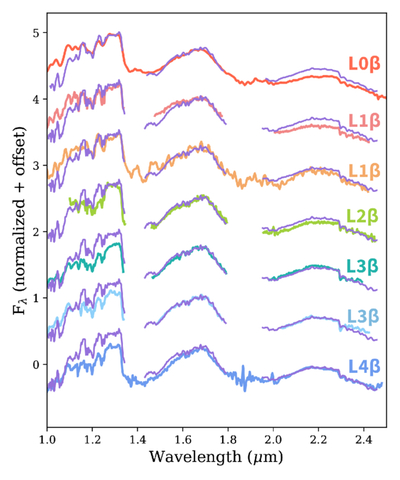
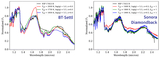
Caption: Figure 6.
GNIRS spectrum of HIP 17453 B (purple curves), plotted against L dwarf near-infrared spectra for the β class of objects (ages 100–500 Myr) as defined by K. L. Cruz et al. (2009) (colored curves) from D. C. Bardalez Gagliuffi et al. (2014) and J. Gagné et al. (2015). All spectra are normalized to the peak H-band flux between 1.67 μm ≤ λ ≤ 1.68 μm. The spectrum of HIP 17453 B is best fit by these early-L spectral standards, with L2 showing the best match across the whole near-infrared continuum.
Other Images in This Article
Show More
Copyright and Terms & Conditions
© 2026. The Author(s). Published by the American Astronomical Society.

Copyright ©
2026 Astronomy Image Explorer. All Rights Reserved.
