

Image Details
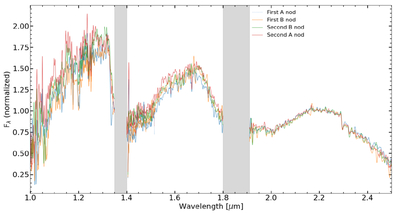
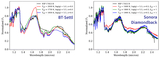
Caption: Figure 5.
Comparison of the extracted 2024 December 21 GNIRS spectra from each nod position (colored curves) with the average spectrum plotted in black. The four observations are in good agreement, with variations on the order of ≤10% excepting the bluest wavelengths in the J-band, indicating the success of the reduction method described in Section 5.2.
Other Images in This Article
Show More
Copyright and Terms & Conditions
© 2026. The Author(s). Published by the American Astronomical Society.

Copyright ©
2026 Astronomy Image Explorer. All Rights Reserved.
