

Image Details
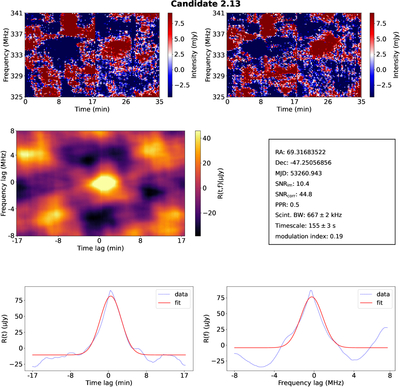
Caption: Figure 2.
Scintillator plot showing the dynamic spectra, cross correlation of dynamic spectra, one-dimensional cross correlation along time and (frequency) axis at zero frequency (time) lag, along with one-dimensional Gaussian fit. In Candidate 2.13, the first and second number corresponds to the scan and compact sources order given by pyBDSF, respectively.
Other Images in This Article
Copyright and Terms & Conditions
© 2026. The Author(s). Published by the American Astronomical Society.

Copyright ©
2026 Astronomy Image Explorer. All Rights Reserved.
