

Image Details
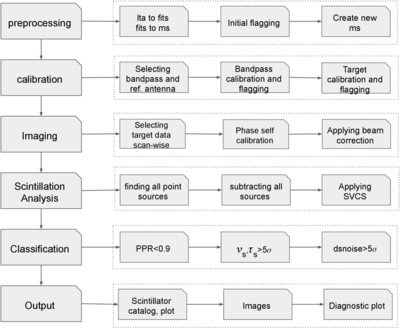
Caption: Figure 1.
The structure of the scintillation pipeline SPICE. The left column shows the broad workflow, beginning with the LTA or FITS file. The row in front of each block in the left column indicates the specific process occurring at that stage. At the end of the pipeline run, the outputs include the radio image, diagnostic plots, and the scintillator catalog with corresponding plots. Here, dsnoise is the dynamic spectrum noise, PPR is the peak-to-peak ratio, νs and τs are the scintillation bandwidth and timescale.
Other Images in This Article
Copyright and Terms & Conditions
© 2026. The Author(s). Published by the American Astronomical Society.

Copyright ©
2026 Astronomy Image Explorer. All Rights Reserved.
