

Image Details
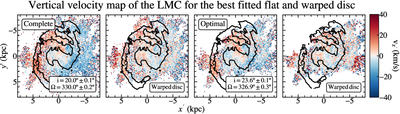
Caption: Figure 14.
Comparison of the median vertical velocity maps for the different LMC combined samples (left two panels: complete sample; right two panels: optimal sample) obtained using SDSS-V and Gaia data with different assumptions about the LMC disk plane, taken from Ó. Jiménez-Arranz et al. (2025). First and third panels: results for the best-fitting flat plane, obtained by minimizing the rms vertical velocity ﹩{v}_{z}^{{\prime} }﹩, with viewing angles listed in the panels. Second and fourth panels:: results for the best-fitting warped plane. When comparing the left and right pairs of panels, the reader should note that the overdensity lines differ slightly because each LMC sample uses a different disk plane.
Other Images in This Article
Show More
Copyright and Terms & Conditions
© 2026. The Author(s). Published by the American Astronomical Society.

