Image Details
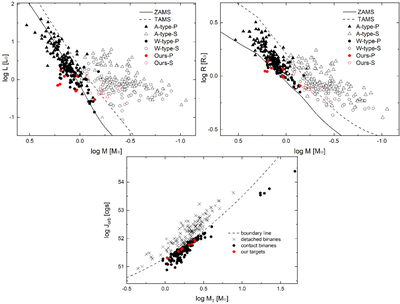
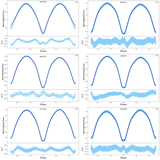
Caption: Figure 5.
The upper left panel illustrates the M–L relation, and the upper right panel shows the M–R relation. The ZAMS and TAMS, computed with the binary star evolution code of J. R. Hurley et al. (2002), are drawn as solid and dashed black lines, respectively. In both panels, solid and open triangles correspond to the more massive and less massive components of A-type contact binaries, while solid and open circles represent the more massive and less massive components of W-type contact binaries. The components of our eight target systems are highlighted in red. The lower panel displays the logJorb– logMT diagram for detached binaries from Z. Eker et al. (2006) and contact binaries from K. Li et al. (2021). Here, crosses denote detached systems, solid circles mark contact systems, and red circles indicate our eight targets. The dashed line corresponds to the empirical boundary separating detached and contact binaries, as determined by Z. Eker et al. (2006).
Other Images in This Article
Copyright and Terms & Conditions
© 2026. The Author(s). Published by the American Astronomical Society.