Image Details
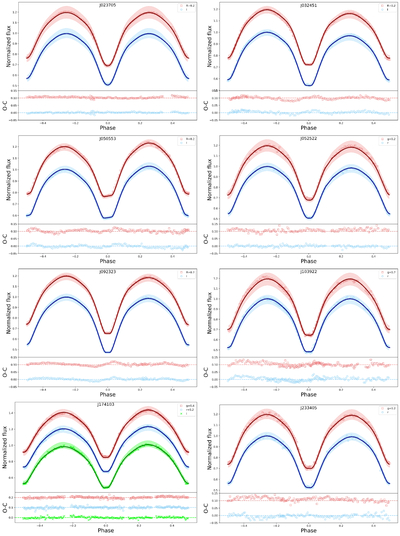
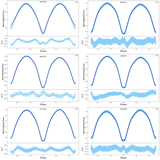
Caption: Figure 3.
These figures present the fitting results for each target. The observed data are shown as scatter points, with the corresponding model fits overlaid as curves. The residuals of the fits are displayed in the lower panels.
Other Images in This Article
Copyright and Terms & Conditions
© 2026. The Author(s). Published by the American Astronomical Society.
Copyright ©
2026 Astronomy Image Explorer. All Rights Reserved.