Image Details
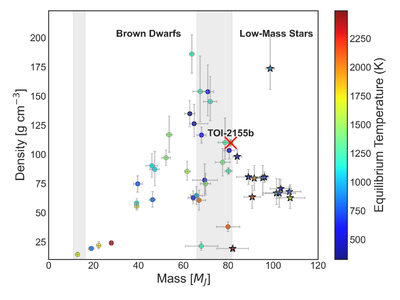
Caption: Figure 12.
Mass–density distribution of transiting BDs and low-mass stars, depicting systems with precision >20% in both mass and density (e.g., C. M. Persson et al. 2019). BDs are shown as circles, color coded by equilibrium temperature (Teq) and with marker size scaled by radius, while low-mass stars are shown as star symbols with the same color coding. The shaded regions indicate the approximate transition regimes corresponding to the deuterium-burning limit (∼11–16.3 MJ; D. S. Spiegel et al. 2011) and the hydrogen-burning boundary (∼66–81.7 MJ; C. V. Morley et al. 2024). The distribution exhibits a turnover in density around ∼60–70 MJ. TOI-2155 b is highlighted with a red “X” over its marker, annotated for emphasis.
Other Images in This Article
Show More
Copyright and Terms & Conditions
© 2026. The Author(s). Published by the American Astronomical Society.