Image Details
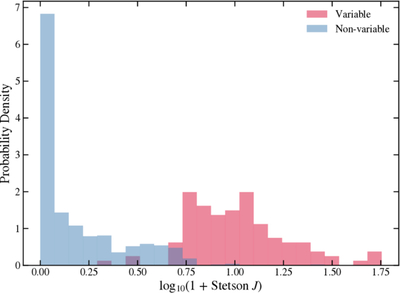
Caption: Figure 4.
Probability density distribution of the two-epoch multiband Stetson index J for all 769 sources in our sample, separated into the variable and nonvariable groups. The x-axis is shown as log10(1 + J) to compress the extended high-J tail and better visualize the separation between the two groups.
Other Images in This Article
Copyright and Terms & Conditions
© 2026. The Author(s). Published by the American Astronomical Society.
Copyright ©
2026 Astronomy Image Explorer. All Rights Reserved.