Image Details
Caption: Figure 4.
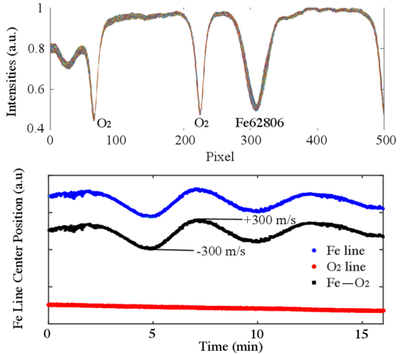
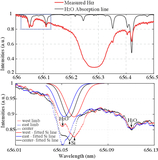
Detection of solar 5 minute oscillations. Top panel: time series of 842 consecutive spectra around the Fe I 6280.57 Å line. Bottom panel: derived Doppler velocity of the Fe I line: the blue line shows the raw measured shift of the Fe line, the red line indicates the shift of the telluric O2 line (used as a reference for spectrograph drift), and the black line represents the corrected Fe line shift after removal of the O2 line drift, revealing oscillations with an amplitude of ∼±300 m s−1.
Other Images in This Article
Copyright and Terms & Conditions
© 2026. The Author(s). Published by the American Astronomical Society.
Copyright ©
2026 Astronomy Image Explorer. All Rights Reserved.