Image Details
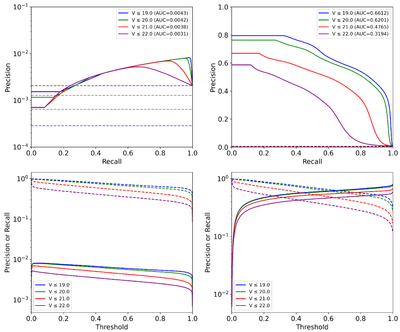
Caption: Figure 13.
(Top left) Solid lines show the PR curve for the labeled positives at V < 19 (blue), V < 20 (orange), V < 21 (green), and V < 22 (red). The dashed horizontal lines show the value of precision at which the model has no discriminative ability for each magnitude threshold (i.e., the outputs are equivalent to randomly guessing). (Top right) Same as top left, but without threshold bins >0.999 or <0.001. (Bottom left) The threshold versus precision (solid lines) and recall (dashed lines). (Bottom right) Same as bottom left, but without threshold bins >0.999 or <0.001.
Other Images in This Article
Show More
Copyright and Terms & Conditions
© 2026. The Author(s). Published by the American Astronomical Society.
Copyright ©
2026 Astronomy Image Explorer. All Rights Reserved.