Image Details
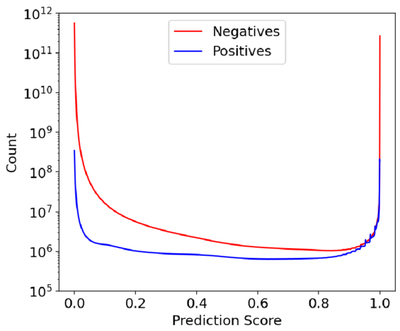
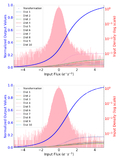
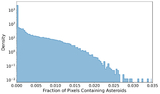
Caption: Figure 12.
The distribution of per-pixel prediction scores according to the truth data positives (blue) and negatives (red). The counts represent binned data at a width of 0.001. Note that, although the domain of the distributions is [0,1], we extend the x-axis on both ends for visual purposes as much of the distributions are close to the limits.
Other Images in This Article
Show More
Copyright and Terms & Conditions
© 2026. The Author(s). Published by the American Astronomical Society.
Copyright ©
2026 Astronomy Image Explorer. All Rights Reserved.