Image Details
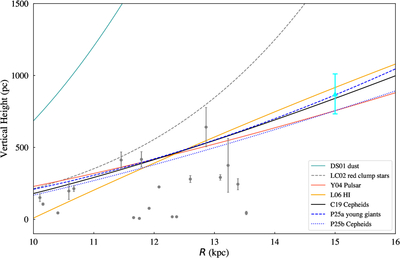
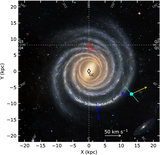
Caption: Figure 6.
Maximum amplitudes of the northern warp overlaid with the vertical heights of HMSFR masers. Similar to X. Chen et al. (2019), all maser samples are presented merely to illustrate a simple warping trend. The gray dots indicate the HMSFR masers collected from the literature, while the cyan triangle marks G040.96+02.48. The curves show maximum warp amplitudes derived from different studies: DS 01, dust (R. Drimmel & D. N. Spergel 2001); LC02, red clump stars (M. López-Corredoira et al. 2002); Y04, pulsars (I. Yusifov 2004); L06, H I (E. S. Levine et al. 2006); C19, Cepheids (X. Chen et al. 2019); P25a (young giants); and P25b (Cepheids; E. Poggio et al. 2025).
Other Images in This Article
Copyright and Terms & Conditions
© 2026. The Author(s). Published by the American Astronomical Society.