Image Details
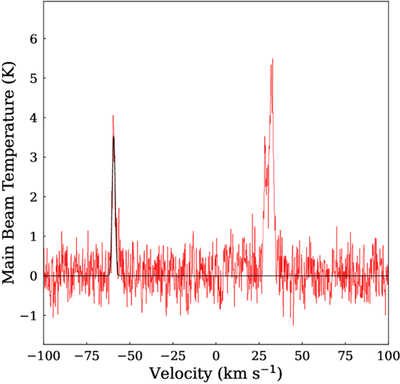
Caption: Figure 3.
12CO(J = 1–0) spectrum of the star-forming region G040.96+02.48. The spectral profile is presented by the red curve, with a Gaussian fit to the far component overlaid as a black line. The LSR velocity component associated with the far side peaks at −59.4 km s−1.
Other Images in This Article
Copyright and Terms & Conditions
© 2026. The Author(s). Published by the American Astronomical Society.
Copyright ©
2026 Astronomy Image Explorer. All Rights Reserved.