Image Details
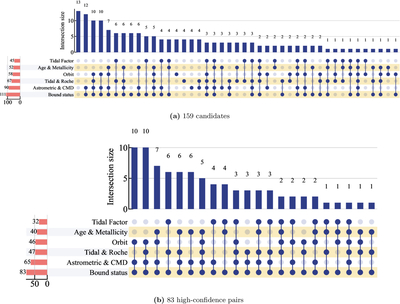
Caption: Figure 6.
UpSet plots of intersections among six diagnostic criteria. Left bars: single-criterion frequencies; top bars: intersection sizes; matrix: filled circles indicate participating criteria.
Other Images in This Article
Copyright and Terms & Conditions
© 2026. The Author(s). Published by the American Astronomical Society.
Copyright ©
2026 Astronomy Image Explorer. All Rights Reserved.