Image Details
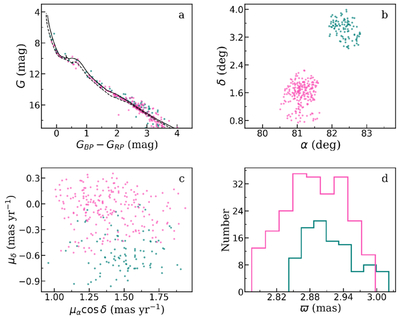
Caption: Figure 4.
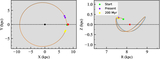
Diagnostic plots for ASCC 21 and Briceno 1: (a) CMDs, (b) sky positions, (c) VPDs, and (d) parallax distributions. Red/black denote the two clusters; dashed curves are best-fitting PARSEC isochrones. Histogram bins in (d) use the Freedman–Diaconis rule.
Other Images in This Article
Copyright and Terms & Conditions
© 2026. The Author(s). Published by the American Astronomical Society.
Copyright ©
2026 Astronomy Image Explorer. All Rights Reserved.