Image Details
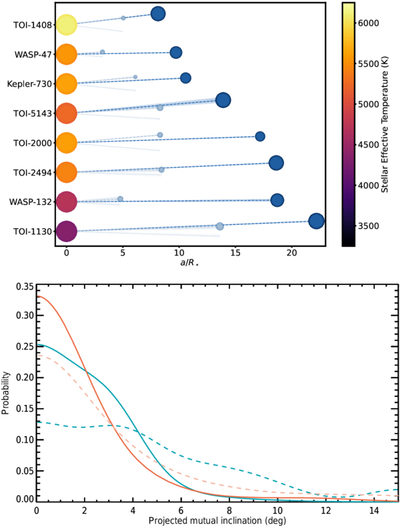
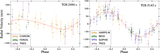
Caption: Figure 5.
Top: a schematic showing the inclinations of hot Jupiters and their interior small companions. Each host star is colored by its effective temperature. The orbital distances and impact parameters are to scale, but the planet sizes have been increased for visibility. Dashed lines and shaded regions indicate the orientation of the orbital planes, with outer giant planets shown in dark blue and inner small planets shown in light blue. Note that the hemisphere across which the planets transit cannot be determined, which we illustrate by plotting the two possible relative positions of the inner orbits—i.e., on the same or opposite hemisphere as the giant planets. Bottom: the distribution of the minimum mutual inclinations illustrated in the top panel (blue lines), smoothed using kernel density estimation, assuming (a) no preference for the hemisphere over which the planets transit (dashed line); or (b) that the planets transit the same hemisphere (solid line). The equivalent distributions of minimum mutual inclinations of small planet systems containing two transiting planets with periods shorter than 10 days are plotted in orange.
Other Images in This Article
Copyright and Terms & Conditions
© 2026. The Author(s). Published by the American Astronomical Society.