Image Details
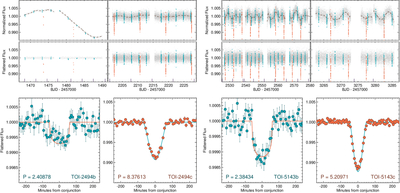
Caption: Figure 1.
Top panels: the normalized raw and flattened TESS light curves of TOI-2494 (left) and TOI-5143 (right). Individual cadences are plotted as small gray points. Note that Sector 6 data for TOI-2494 were extracted from the 30 minute FFIs, while all other datasets shown are the SPOC PDCSAP 2 minute cadence data. In-transit data for planets b and c in each system are colored blue and orange, respectively. The out-of-transit spline models used to flatten the light curves are shown as a dashed brown line. The times of reaction wheel desaturation events, which often induce discontinuities in the light curve and are used as additional spline break points, are marked in purple along the x-axes. Bottom panels: the binned, phase-folded TESS light curves of TOI-2494 b and c (left) and TOI-5143 b and c (right), along with the best-fit EXOFASTv2 transit models. Note that the shallow transits and the deeper transits are plotted with different y-axis scales for improved visibility of transit shapes.
Other Images in This Article
Copyright and Terms & Conditions
© 2026. The Author(s). Published by the American Astronomical Society.