Image Details
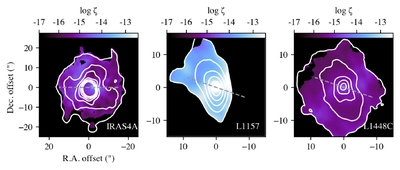
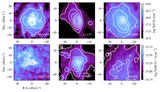
Caption: Figure 6.
Cosmic-ray ionization rate derived from the abundance ratio of HCO+ and CO assuming an electron abundance equal to the HCO+ abundance (P. Caselli et al. 2002). The ionization rate is calculated only in regions where both tracers are detected at >3σ. Contours indicate the C18O 2–1 emission, from 3 to 21 times the rms in five equally spaced steps. The C18O for IRAS4A is shown after correcting for absorption. In each panel, the gray dashed line is perpendicular to the small scale outflow.
Other Images in This Article
Copyright and Terms & Conditions
© 2026. The Author(s). Published by the American Astronomical Society.
Copyright ©
2026 Astronomy Image Explorer. All Rights Reserved.