Image Details
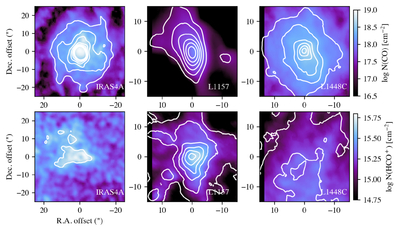
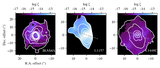
Caption: Figure 5.
Maps of the derived column densities for CO (top) and HCO+ (bottom) based on our observations of C18O and H13CO+, respectively. Contours indicate the isotopologue emission from 3 to 21 times the rms in five equally spaced steps.
Other Images in This Article
Copyright and Terms & Conditions
© 2026. The Author(s). Published by the American Astronomical Society.
Copyright ©
2026 Astronomy Image Explorer. All Rights Reserved.