Image Details
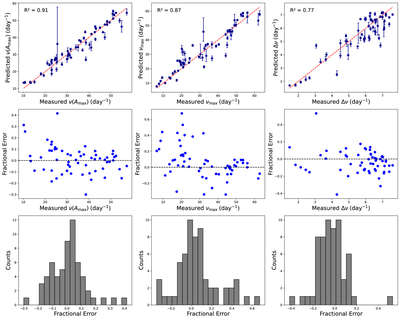
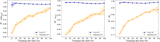
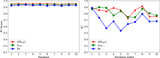
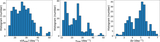
Caption: Figure 5.
The predicted median with associated upper and lower uncertainties vs. the measured values for 60 δ Sct stars (top row), fractional errors (middle row), and distribution of fractional error (bottom row) obtained by ensemble ML for ν(Amax) (left panel), νmax (middle panel), and Δν (right panel; see supplementary electronic table hosted by Figure 1). The red dashed line (y = x) shows the ideal prediction line in the top row, whereas the black dashed line marks the zero fractional error reference in the bottom row.
Other Images in This Article
Copyright and Terms & Conditions
© 2026. The Author(s). Published by the American Astronomical Society.
Copyright ©
2026 Astronomy Image Explorer. All Rights Reserved.