Image Details
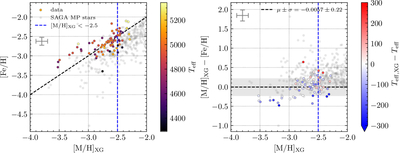
Caption: Figure 4.
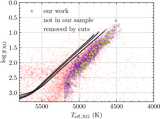
The original XGBoost selection remains accurate, even down to low metallicities. Shown is a comparison of [M/H] estimates and [Fe/H] measurements, colored by Teff. Left: direct comparison; [Fe/H] from our work vs. [M/H] estimates from R. Andrae et al. (2023). Right: differences between estimations (XG: our results). The selection cut applied to the catalog for observations is overplotted in blue. Both plots show minimal scatter for the majority of the stars, with outliers driven by differences in effective temperature. Metal-poor stars from the SAGA database are also plotted, which are consistently labeled as metal-poor stars.
Other Images in This Article
Show More
Copyright and Terms & Conditions
© 2026. The Author(s). Published by the American Astronomical Society.