Image Details
Caption: Figure 1.
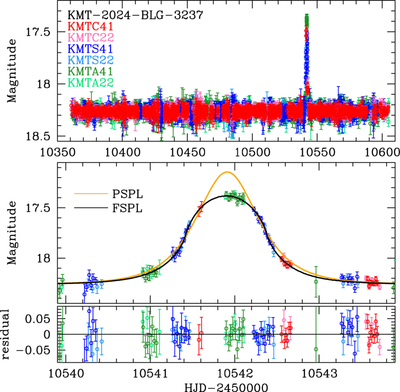
Light curve of KMT-2024-BLG-3237. The upper panel displays the full light curve from the 2024 season, while the lower panel provides the zoom-in of the event. The black and orange curves indicate the FSPL (fB = 0) and the PSPL model, respectively. The photometry is available in machine readable format as the data behind the figure.
(The data used to create this figure are available in the online article.)
(The data used to create this figure are available.)
Other Images in This Article
Copyright and Terms & Conditions
© 2026. The Author(s). Published by the American Astronomical Society.
Copyright ©
2026 Astronomy Image Explorer. All Rights Reserved.