Image Details
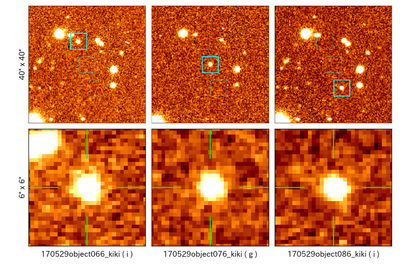
Caption: Figure B1.
An example of the diagram used for visual inspection. The top three panels show squares representing the position of each of the three visits, from left to right of the moving object corresponding to the JT motion derived from the light source catalog. The images at the first and third visits are taken with the ﹩i^{\prime} ﹩-band filter, while the ﹩g^{\prime} ﹩-band filter was used for the second visits. The bottom panels are an enlarged version of the image within the upper square with the thick line. The field of view is 6” × 6”. The green lines are drawn to make it easier to see the center of the square.
Other Images in This Article
Copyright and Terms & Conditions
© 2026. The Author(s). Published by the American Astronomical Society.