Image Details
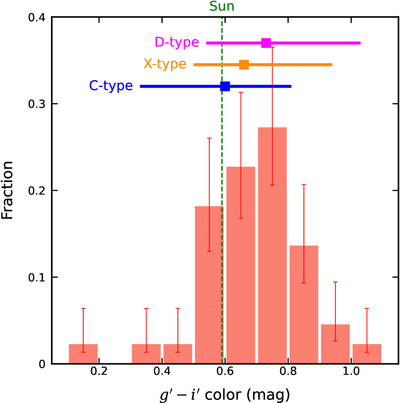
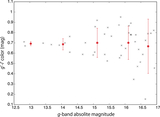
Caption: Figure 4.
The histogram of the ﹩g^{\prime} -i^{\prime} ﹩ color distribution of the unbiased JT sample. Error bars are based on Poisson errors. The dashed line shows the color of the Sun (E. Bertin & S. Arnouts 1996). The squares with solid lines show the mode values and color ranges, respectively, of the C-, X-, and D-type asteroids derived from the SDSS-based Asteroid Taxonomy database (P. H. Hasselmann et al. 2011).
Other Images in This Article
Copyright and Terms & Conditions
© 2026. The Author(s). Published by the American Astronomical Society.
Copyright ©
2026 Astronomy Image Explorer. All Rights Reserved.