Image Details
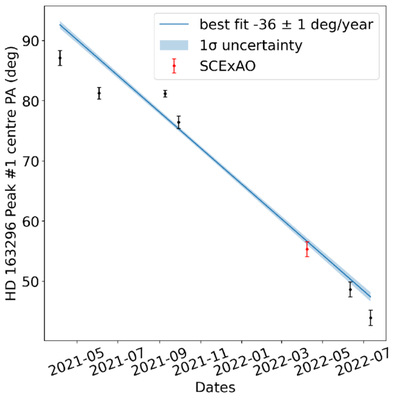
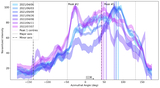
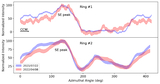
Caption: Figure 8.
Azimuthal brightness movement of HD 163296 Peak #1 over time. The peak brightness locations were determined by fitting the peak with MCMC. The linear best-fit line shows an average rate of change in peak location that corresponds to an R2 = 0.95 coefficient.
Other Images in This Article
Show More
Copyright and Terms & Conditions
© 2026. The Author(s). Published by the American Astronomical Society.
Copyright ©
2026 Astronomy Image Explorer. All Rights Reserved.