Image Details
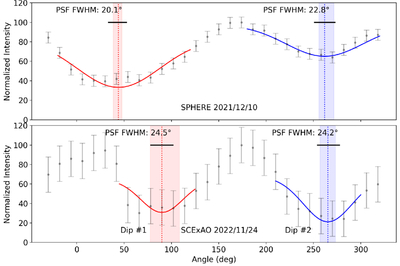
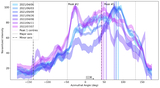
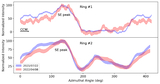
Caption: Figure 5.
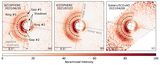
Azimuthal brightness profiles measured at a deprojected radius of 0﹩\mathop{.}\limits^{^{\prime\prime} }﹩19 for two epochs of MWC 480 PDI observations. The y-axis is in the same normalized intensity units as Figure 4. The red curves are a Gaussian fit (Equation (7)) to the brightness dips on the east side of the image (Dip #1), while the blue curves are the Gaussian fit to the west (Dip #2). The PSF FWHM bars represent the angular resolution at the position of the Gaussian fit centers. The dotted lines show the centers of each brightness dip with the shading showing the 1σ errors.
Other Images in This Article
Show More
Copyright and Terms & Conditions
© 2026. The Author(s). Published by the American Astronomical Society.
Copyright ©
2026 Astronomy Image Explorer. All Rights Reserved.