Image Details
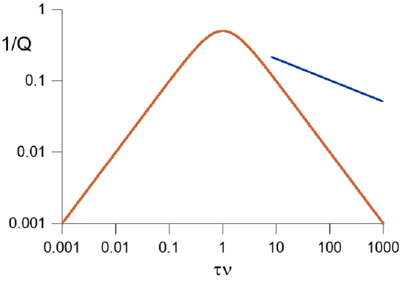
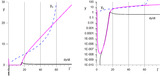
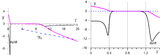
Caption: Figure 9.
Maxwell rheology. Log–log plot of the inverse of the quality factor Q as a function of τν. The blue line shows the slope of the descending branch in the case of Andrade rheology with p = −0.2.
Other Images in This Article
Copyright and Terms & Conditions
© 2026. The Author(s). Published by the American Astronomical Society.
Copyright ©
2026 Astronomy Image Explorer. All Rights Reserved.