Image Details
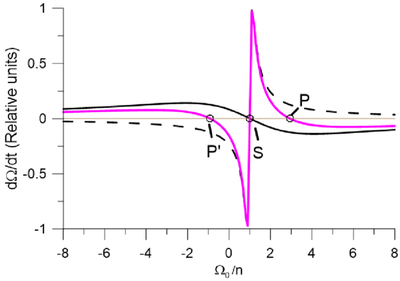
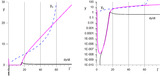
Caption: Figure 4.
Phase diagram ﹩\dot{{\rm{\Omega }}}({\rm{\Omega }})﹩ resulting from the composition (red) of the tidal (solid black) and atmospheric (dashed) torques. The intersections of the red curve with the axis ﹩\dot{{\rm{\Omega }}}=0﹩ (brown) are the stationary solutions: The unstable synchronous solution ﹩{\mathsf{S}}﹩ and two stable asynchronous solutions ﹩{\mathsf{P}}﹩ and ﹩{{\mathsf{P}}}^{{\prime} }﹩, one prograde and one retrograde. The adopted factors γ and ﹩{\gamma }^{{\prime} }﹩ were exaggerated to improve the visibility of the plot’s main features.
Other Images in This Article
Copyright and Terms & Conditions
© 2026. The Author(s). Published by the American Astronomical Society.
Copyright ©
2026 Astronomy Image Explorer. All Rights Reserved.