Image Details
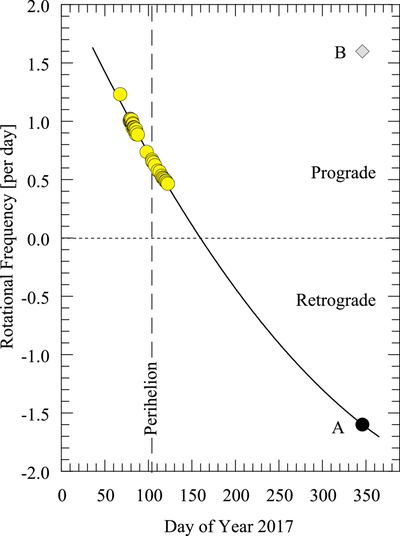
Caption: Figure 4.
Rotational frequency as a function of time expressed as Day of Year in 2017. The yellow-filled circles show data from D. Bodewits et al. (2018) and D. G. Schleicher et al. (2019). Points A (black-filled circle) and B (gray diamond) show the two solutions for prograde and retrograde rotation deduced from the HST lightcurve. The solid black line is a parabola added to guide the eye. Frequencies above (below) the dashed horizontal line are prograde (retrograde). The date of perihelion is indicated by a dashed vertical line.
Other Images in This Article
Copyright and Terms & Conditions
© 2026. The Author(s). Published by the American Astronomical Society.
Copyright ©
2026 Astronomy Image Explorer. All Rights Reserved.